
Global Data Quality

By Mohamed KHEY
April 16, 2026
Global Data Quality Automation
Data quality cannot depend on manual checks when business systems, data warehouses, and reporting tools are changing every day.
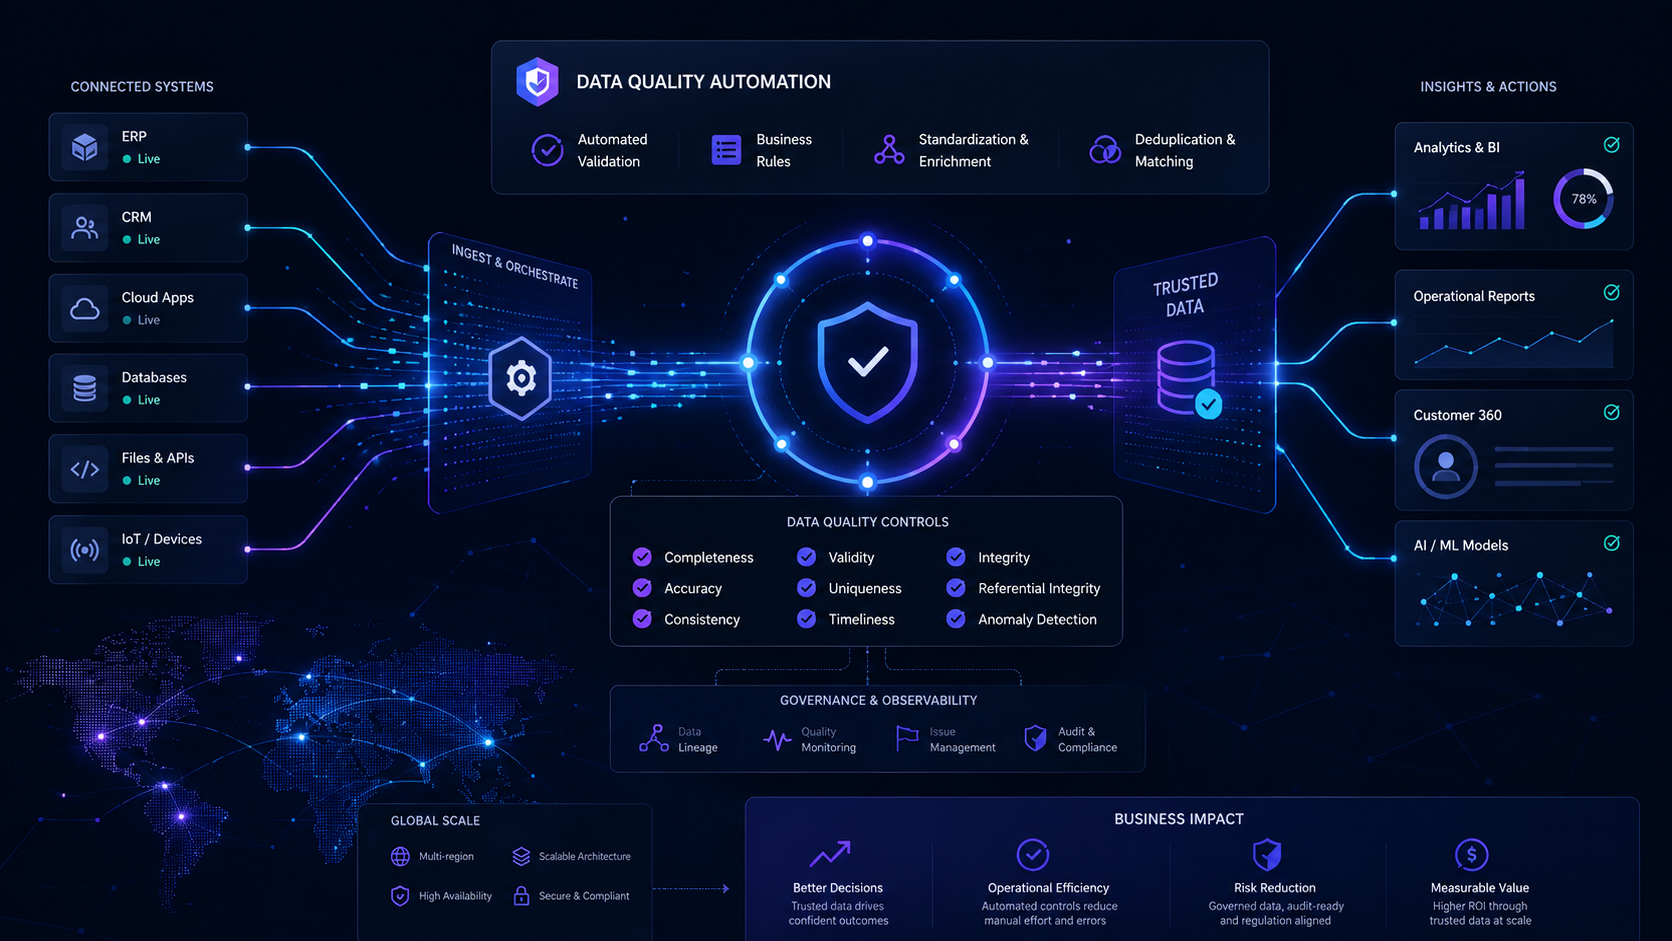
As organizations grow, their data landscape becomes more complex. New applications are added, business processes evolve, teams create new reports, pipelines are modified, and data models change continuously.
In this environment, manual data checks are no longer enough. They are too slow, too inconsistent, and too dependent on individual knowledge.
Global data quality automation is the discipline of automatically detecting, monitoring, validating, and preventing data issues across the entire data ecosystem. It is not just about checking whether a column is empty or whether a file has arrived. It is about creating a systematic layer of trust between operational systems, analytical platforms, business users, and decision-makers.
Core idea
The practical objective
Make data quality measurable, visible, and controlled at scale so teams can move from reactive investigation to proactive data reliability.
Why Data Quality Automation Has Become Critical
Many companies start with simple reports and manual controls. At the beginning, this may work. A data analyst checks a spreadsheet. A data engineer verifies a pipeline. A business user confirms whether a dashboard looks correct.
But as the business grows, this approach breaks down.
More systems are connected. More teams consume the same data. More dashboards are created. More decisions depend on automated reports. A small data issue that was once easy to detect can become a major business risk.
- A CRM field changes and revenue reports become inconsistent.
- A pipeline fails silently and a dashboard shows outdated numbers.
- A duplicate customer record affects segmentation and campaign performance.
- A missing reference value causes incorrect financial reporting.
- A new product code is introduced but not mapped correctly.
- A business rule changes, but the data validation logic is not updated.
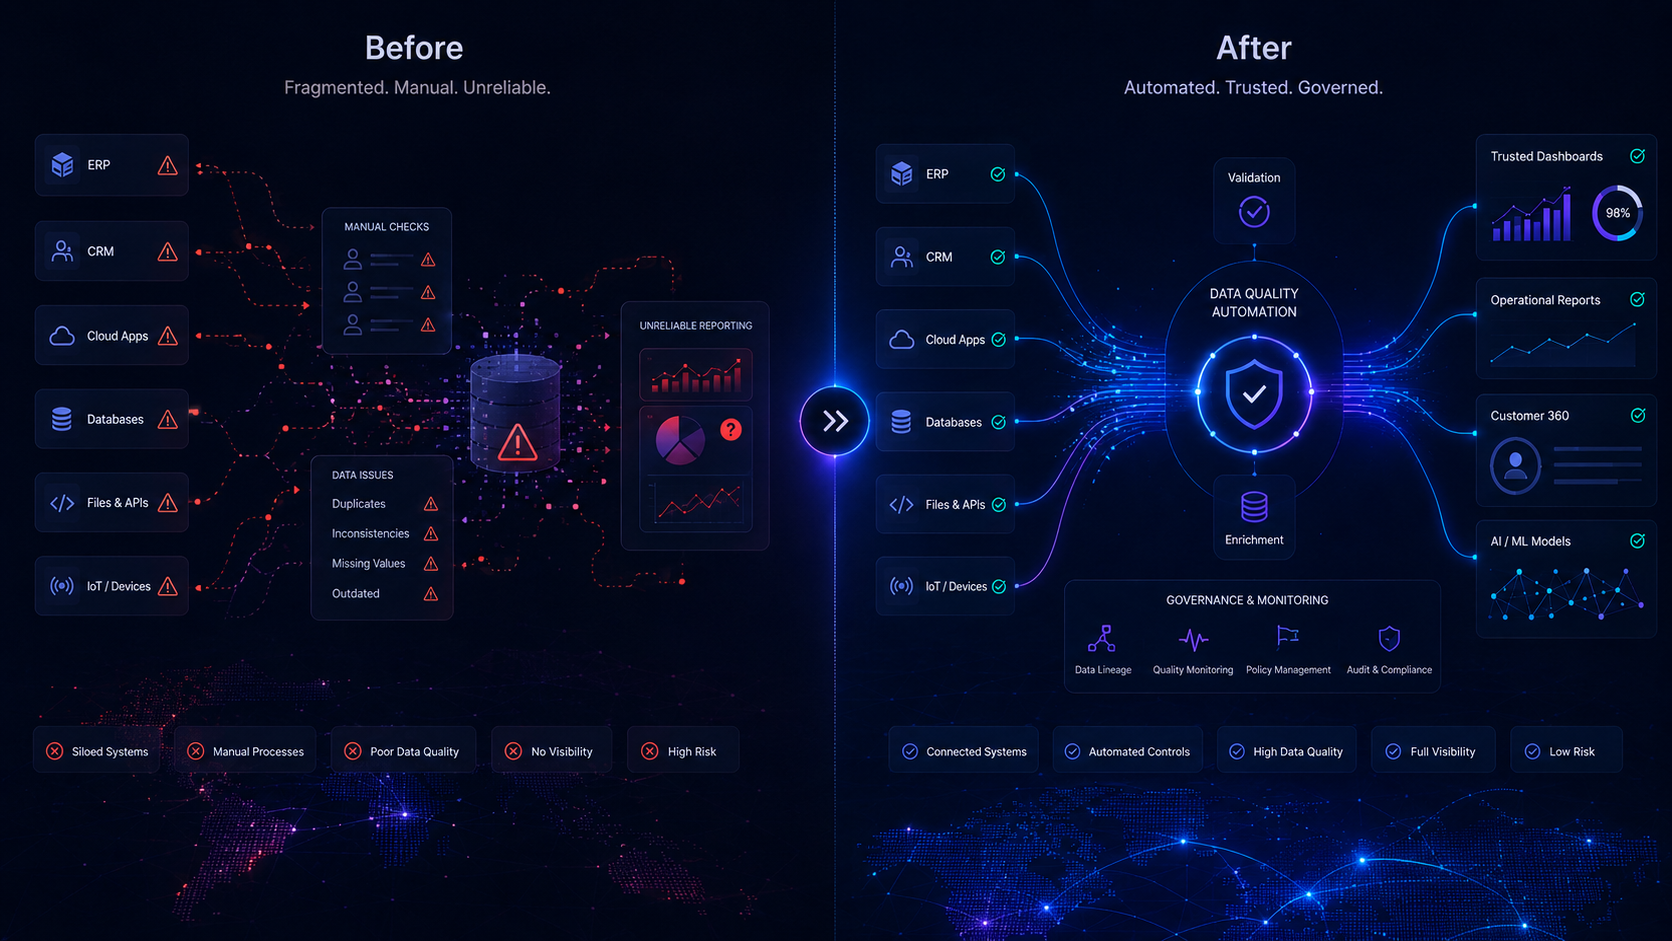
In each case, the problem is not only technical. It creates doubt. Teams lose confidence in the data. Meetings become discussions about whether the numbers are correct instead of what actions should be taken.
This is why data quality automation is no longer optional. It is a foundation for reliable operations, trustworthy reporting, and scalable governance.
Global scope
What Is Global Data Quality Automation?
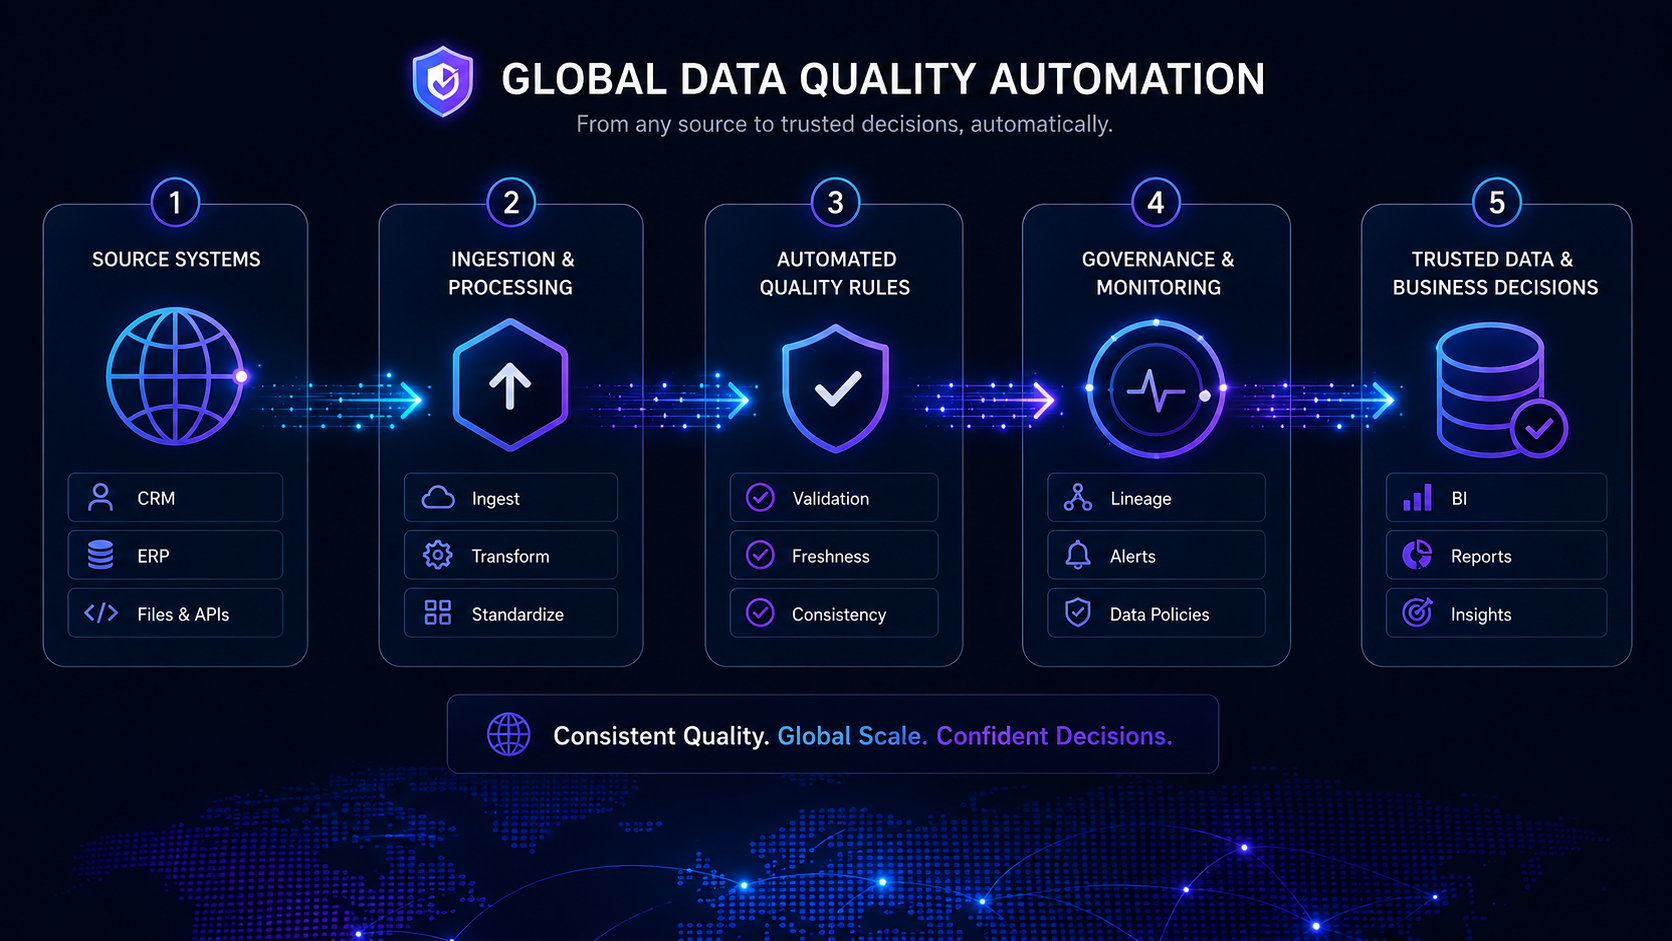
Global data quality automation means applying automated controls across the full data lifecycle, from source systems to business consumption.
It covers source systems such as CRM, ERP, finance tools, HR platforms, e-commerce systems, and operational applications; ingestion pipelines that collect and move data; warehouses, lakes, and lakehouses where information is transformed and stored; data models used for reporting and analytics; BI dashboards; business rules; reference data; and governance workflows.
The word global is important. Data quality should not be limited to one table, one pipeline, or one team. A reliable strategy must cover the entire chain.
A dashboard can only be trusted if the source data, transformation logic, reference data, and reporting layer are all controlled.
The Limits of Manual Data Quality Checks
Manual checks usually appear harmless at first. A person validates a file. Another person compares two reports. A data engineer checks logs after a pipeline execution.
The problem is that manual controls do not scale.
They depend on people remembering what to check. They are often performed after the issue has already affected the business. They are difficult to standardize across teams. They are not always documented. They are rarely exhaustive. They are also vulnerable to human error.
Manual checks also create hidden operational costs. Highly skilled people spend time verifying data manually instead of improving systems, automating processes, or helping the business extract value from data.
A modern business needs a data quality system that runs continuously, detects anomalies automatically, alerts the right people, and provides clear evidence of what happened.
Quality dimensions
The Main Dimensions of Data Quality
Before automating data quality, organizations need to define what good data means. Quality is not a single concept; it combines completeness, accuracy, consistency, validity, uniqueness, timeliness, and integrity.
Completeness
Required data is present before it supports reporting, billing, compliance, segmentation, or operations.
- Customer email must not be empty.
- Invoice date must be populated.
- Product category must exist.
Accuracy
Data correctly represents the business reality it is supposed to describe.
- A product price should match the approved pricing system.
- A financial amount should match the source transaction.
- A delivery status should reflect the actual logistics status.
Consistency
The same information is represented in the same way across systems, teams, reports, and models.
- The same customer should have the same identifier across CRM, billing, and support tools.
- Currency formats should be standardized.
- Dates should follow the same timezone rules.
Validity
Values follow expected formats, ranges, reference lists, and accepted business states.
- Email addresses must follow a valid format.
- Percentages must be between 0 and 100.
- Order status must belong to an accepted list of values.
Uniqueness
Records are not duplicated when the business object should exist only once.
- One invoice number should not exist twice.
- One transaction ID should be unique.
- One product SKU should not be duplicated.
Timeliness
Data is available when users, workflows, dashboards, and decisions need it.
- Daily sales data should be refreshed before 8 a.m.
- A source file should arrive every day.
- A real-time feed should not exceed its latency threshold.
Integrity
Relationships between business objects are respected across datasets and applications.
- Every order must be linked to an existing customer.
- Every invoice must be linked to a valid contract.
- Every product in sales data must exist in the product master table.
Why Quality Must Be Automated Across the Entire Data Chain
A common mistake is to place data quality checks only at the end of the pipeline, usually in dashboards or reporting tables. This is not enough.
By the time a data issue appears in a dashboard, the problem may have already passed through several systems. It may have been transformed, aggregated, and consumed by multiple teams.
A better approach is to apply controls at different levels.
Source level
Operational systems produce valid and usable data before it enters analytics.
- Required CRM fields are completed.
- Product references follow naming standards.
- Finance transactions contain mandatory accounting dimensions.
- Customer records include valid identifiers.
Ingestion level
Data arrives correctly from files, APIs, streams, and application connectors.
- Expected files are received.
- Schema has not changed unexpectedly.
- Row count is within an expected range.
- Data freshness is acceptable.
Transformation level
Processing logic preserves meaning, applies rules, and avoids hidden defects.
- Joins do not unexpectedly change row counts.
- Aggregations produce expected totals.
- Mandatory mappings are applied.
- No critical field is lost during transformation.
Warehouse or lakehouse level
Core analytical assets remain stable, current, connected, and auditable.
- Fact tables are updated.
- Dimensions are consistent.
- Referential integrity is respected.
- Partition freshness is correct.
Reporting level
Dashboards and certified metrics stay reliable at the point of decision.
- Key metrics do not show abnormal variations.
- Revenue totals match certified datasets.
- Reports use approved data sources.
- Dashboard refreshes complete successfully.
Automated controls
Types of Automated Data Quality Controls
A strong data quality automation framework combines explicit rules, reference checks, schema monitoring, volume signals, freshness checks, reconciliation, anomaly detection, duplicate detection, and business validation.
Rule-based controls
Explicit checks defined by technical or business teams.
- customer_id must not be null.
- order_amount must be greater than zero.
- invoice_date cannot be in the future.
Referential controls
Values are verified against approved reference data.
- Country code exists in the reference table.
- Product code exists in the catalog.
- Cost center exists in finance reference data.
Schema controls
Structural changes are detected before they break pipelines or dashboards.
- A column is removed.
- A column type changes.
- A nested API structure changes.
Volume controls
Abnormal changes in row counts, file sizes, or table growth are detected automatically.
- A daily file drops from 100,000 rows to 500.
- A source sends twice the normal volume.
- A pipeline produces an empty output.
Freshness controls
Data is checked against expected arrival, refresh, and latency expectations.
- A table refreshes every morning.
- A dashboard uses data less than 24 hours old.
- A stream remains within latency limits.
Reconciliation controls
Data is compared between systems, processing steps, or certified datasets.
- Warehouse sales match source sales.
- Loaded invoices match extracted invoices.
- Finance dashboard revenue matches certified tables.
Anomaly detection
Historical patterns reveal unusual behavior that fixed rules may not capture.
- Revenue drops unexpectedly.
- Conversion rate increases abnormally.
- Data latency suddenly increases.
Duplicate detection
Repeated records are identified with exact rules, fuzzy matching, or similarity scores.
- Duplicate customers with similar names and emails.
- Duplicate invoices with the same amount and date.
- Duplicate transactions after reprocessing.
Business rule validation
Operational logic is translated into automatic controls.
- A closed opportunity must have a close date.
- A paid invoice must have a payment date.
- A contract end date must be after the start date.
The Role of Metadata in Data Quality Automation
Metadata is the information that describes data: where it comes from, how it is transformed, who owns it, when it was updated, and how it is used.
Without metadata, data quality automation remains limited.
A mature data quality platform should connect rules with metadata, lineage, ownership, and business context. This transforms data quality from a technical control into a governance capability.
- Which system produced this data?
- Which pipeline transformed it?
- Which dashboards depend on it?
- Who owns this dataset?
- When was it last updated?
- Which quality rules apply to it?
- What happens if this table fails?
- Which business teams are impacted?
Data Quality Automation and Data Governance
Data quality automation is one of the strongest pillars of data governance. Governance defines who owns data, what rules apply, which data is certified, and how issues should be managed. Automation makes these rules operational.
Without automation, governance often remains theoretical. Policies are written, but not consistently enforced. Data owners are named, but not alerted. Quality rules are defined, but not monitored.
With automation, governance becomes measurable.
- Number of data quality issues by domain.
- Criticality of failed rules.
- Time to detect issues.
- Time to resolve issues.
- Most unstable datasets.
- Most impacted dashboards.
- Rule coverage by business domain.
- Data quality score by system, table, or owner.
Data Quality Automation and Master Data Management
Master data management, or MDM, focuses on core business entities such as customers, products, suppliers, employees, locations, contracts, or assets.
These entities are used across multiple systems. If they are inconsistent, duplicated, or incomplete, the entire data ecosystem becomes unreliable.
Data quality automation can detect master data issues automatically and support workflows where business users review, validate, approve, or correct them. Many master data problems cannot be solved only by technical teams. They require business ownership.
- Duplicate customers.
- Missing product attributes.
- Invalid supplier identifiers.
- Inconsistent naming conventions.
- Unmapped business units.
- Broken hierarchy relationships.
- Invalid reference values.
Modern platforms
Data Quality Automation in Modern Data Platforms
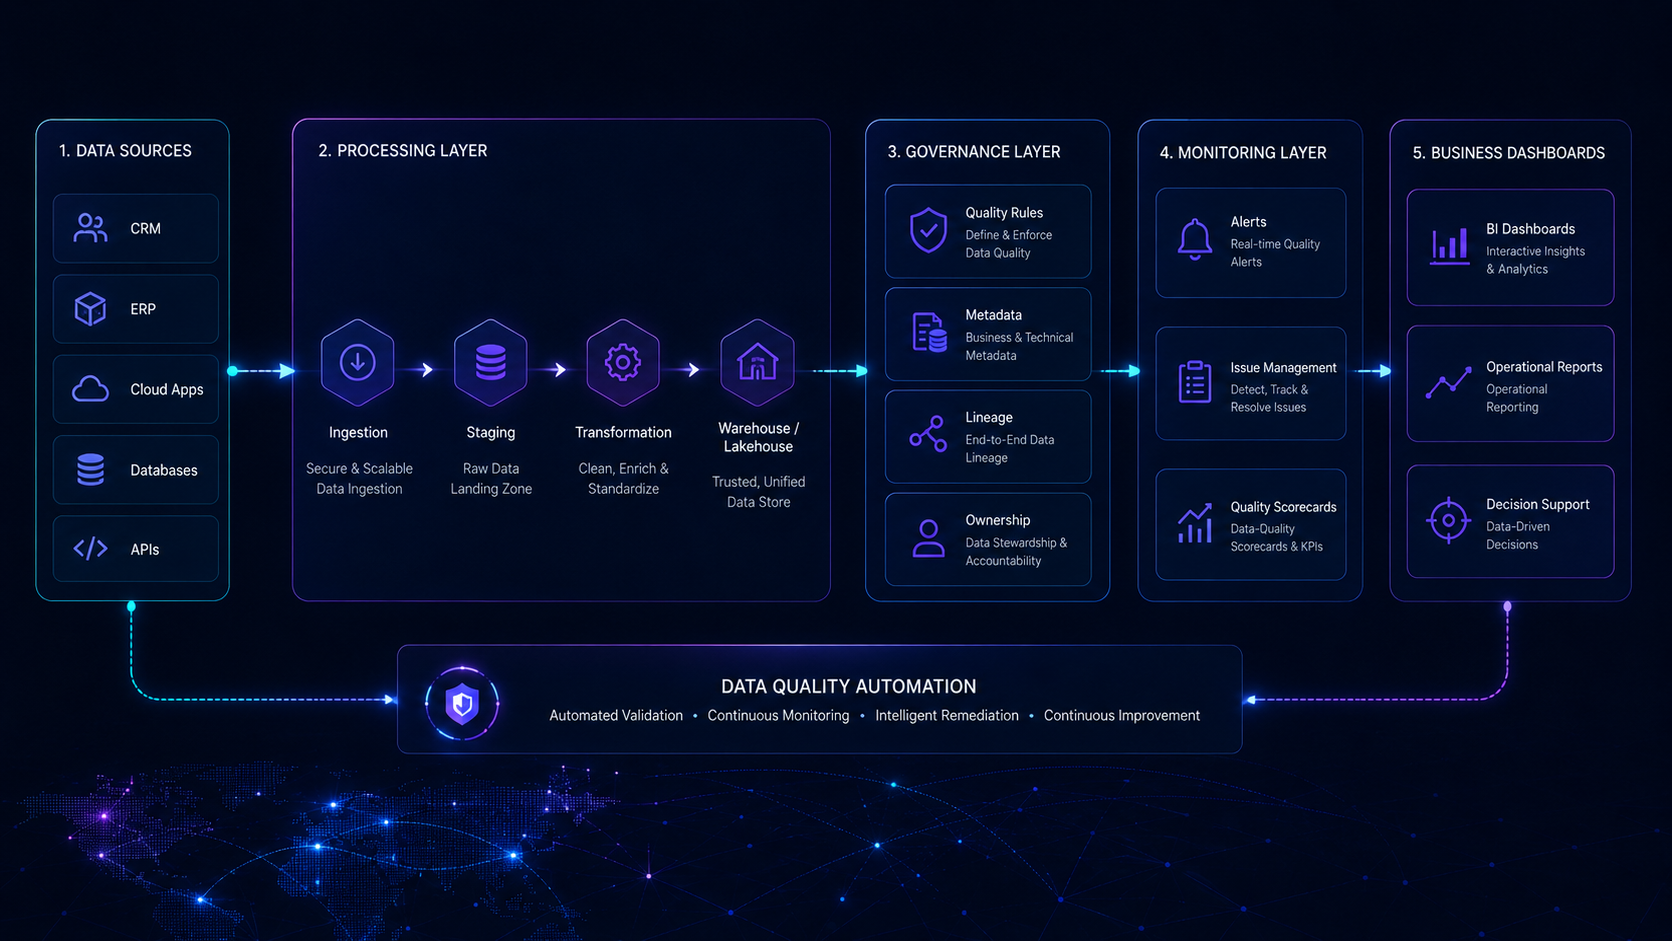
Modern data platforms usually include source systems, ingestion tools, storage, transformation, semantic layers, BI tools, data catalogs, monitoring, and observability.
Data quality automation should not be an isolated tool that only produces alerts. It should be connected to orchestration, lineage, documentation, ownership, and incident management.
- When a pipeline finishes, quality checks run automatically.
- When a rule fails, the pipeline may stop or continue depending on severity.
- When a critical dataset is affected, the data owner is notified.
- When a dashboard uses bad data, users see a warning.
- When an issue is resolved, the status is tracked.
- When the same issue repeats, it triggers a root cause analysis.
Framework
Designing a Global Data Quality Automation Framework
A strong framework combines a rules repository, severity model, automated execution, alerts, issue workflows, dashboards, scorecards, and ownership.
Rules repository
A central place for rule name, description, target dataset, field, owner, severity, validation logic, trigger, and expected action.
Severity levels
A prioritization model that separates critical finance, compliance, billing, and executive reporting defects from lower-impact improvements.
Automated execution
Checks run after pipeline execution, on schedule, when data arrives, before certified publication, or during model deployment.
Alerting
Notifications explain what failed, where it failed, why it matters, which records are affected, and who owns the response.
Issue workflow
Issues are created, assigned, investigated, commented, resolved, measured, and linked to root causes.
Scorecards
Dashboards track pass rates, failures by severity, freshness, rule coverage, affected datasets, and resolution time.
Ownership model
Business owners, technical owners, data stewards, and consumer owners know what they are accountable for.
Preventive Data Quality vs Reactive Data Quality
Many organizations only react to data quality issues after users complain. This is reactive data quality, and it is expensive because the issue has already created damage.
Preventive data quality aims to detect and stop issues earlier. The more issues are prevented upstream, the less expensive they are to fix.
- Validate source data before ingestion.
- Reject invalid records before they enter the warehouse.
- Detect schema changes before pipelines break.
- Run tests before deploying transformation changes.
- Block publication of certified datasets if critical checks fail.
- Alert business owners before dashboards are refreshed.
Data Quality Automation and Data Observability
Data observability is the ability to understand the health of data systems through signals such as freshness, volume, schema, lineage, distribution, and anomalies.
Observability detects that something unusual happened. Data quality rules determine whether the data violates defined expectations.
- Observability detects that a table has not refreshed; quality rules detect that mandatory customer fields are missing.
- Observability detects an abnormal row count drop; quality rules identify which business rule is violated.
- Observability shows which dashboards are impacted; quality workflows assign the issue to the right owner.
Data Quality Automation in BI and Reporting
Business intelligence is often where data quality problems become visible. Users may notice that numbers changed unexpectedly, two dashboards show different results, a KPI does not match finance reports, filters behave incorrectly, data is missing for a period, or reports are not refreshed.
Automated quality controls can protect BI environments by validating data before it reaches dashboards.
- Certified dataset checks.
- KPI consistency checks.
- Dashboard freshness checks.
- Metric reconciliation.
- Semantic model validation.
- Access to approved data sources only.
- Detection of outdated or duplicated reports.
Data Quality Automation for Business Systems
Data quality is not only a data warehouse problem. Many issues originate in operational tools such as CRM, ERP, finance, HR, or support systems.
Automating data quality directly around business systems helps improve operational performance, not only reporting.
- Sales teams may create duplicate accounts.
- Opportunities may move stages without required fields.
- Lead sources may be inconsistent.
- Revenue forecasts may use incomplete information.
- Supplier data may be incomplete.
- Product references may be inconsistent.
- Cost centers may be missing.
- Invoices may not match expected rules.
The Importance of Business Rules
Technical checks are necessary, but they are not enough.
A table can be technically valid and still be wrong from a business perspective. A field may not be null but still be incorrect. A date may have the right format but violate a business process. A transaction may exist but be assigned to the wrong business unit.
Business rules translate operational knowledge into automated controls. They connect data quality with how the company actually works.
The strongest data quality systems are built with both technical and business rules.
Data Quality Automation and Change Management
Data environments change constantly. New fields are added. APIs evolve. Business definitions change. Systems are migrated. Teams create new dashboards. Data models are refactored.
Without change management, data quality automation can become outdated. Data quality must evolve with the business.
- Versioning of data quality rules.
- Approval workflow for rule changes.
- Impact analysis before schema changes.
- Automated tests before deployment.
- Documentation of business definitions.
- Monitoring after release.
- Communication to affected users.
Implementation roadmap
How to Implement Data Quality Automation Step by Step
A global data quality automation strategy should be implemented progressively. Trying to control everything at once usually fails.
Identify critical data domains
Prioritize customer, product, revenue, finance, sales pipeline, supplier, and operational data based on business impact.
Map critical data flows
For each domain, identify source systems, ingestion pipelines, transformations, storage tables, reports, users, owners, and known pain points.
Define key quality rules
Start with high-impact required fields, reference values, freshness checks, volume checks, duplicate checks, reconciliation checks, and business rules.
Automate execution
Run checks automatically after ingestion, after transformation, before reporting, and where possible inside orchestration or CI/CD.
Set ownership and alerts
Every rule should have an owner, and every alert should be routed to the people who can investigate and solve the issue.
Create a data quality dashboard
Track failures, trends, severity, resolution time, affected records, impacted dashboards, and rule coverage.
Improve continuously
Rules evolve, thresholds are adjusted, new systems are integrated, and recurring issues are analyzed at the root cause.
Workflow example
Example of an Automated Data Quality Workflow
- 1
A source file arrives in cloud storage.
- 2
The ingestion pipeline starts.
- 3
The system checks file presence, format, schema, and volume.
- 4
If the file is invalid, the pipeline stops and an alert is sent.
- 5
If the file is valid, data is loaded into a staging table.
- 6
Staging quality checks run automatically.
- 7
Invalid records are isolated in an error table.
- 8
Valid records continue to transformation.
- 9
Business rules and reconciliation checks are applied.
- 10
Certified tables are updated only if critical checks pass.
- 11
BI dashboards refresh from certified data.
- 12
Quality results are stored in a monitoring table.
- 13
A dashboard shows quality status, failures, trends, and owners.
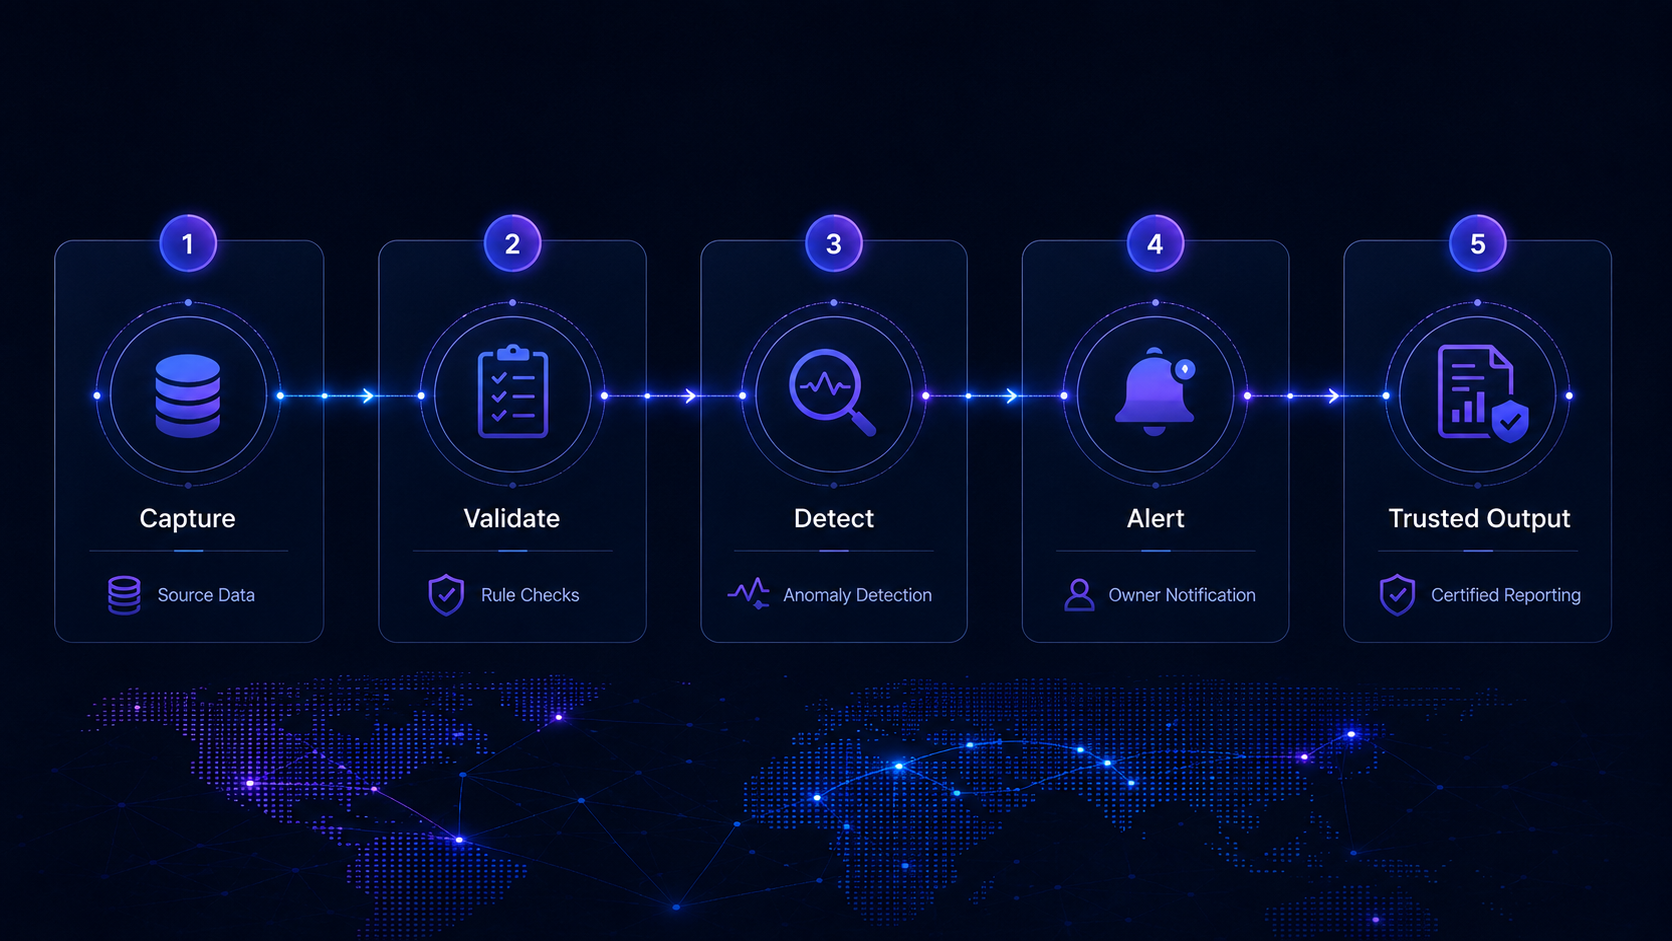
Common Mistakes to Avoid
Data quality automation succeeds when teams focus on impact, ownership, actionability, and continuous improvement. The common mistakes are usually organizational as much as technical.
Checking data only at the end
If quality checks only happen in dashboards, issues are detected too late.
Creating too many rules too quickly
A large number of rules can create alert fatigue. Start with critical rules and expand gradually.
Ignoring business ownership
Technical teams cannot define all quality rules alone. Business owners must be involved.
Treating alerts as the final step
Detection is not enough. There must be an issue resolution process.
Not measuring data quality over time
Without metrics, teams cannot know whether quality is improving.
Hardcoding rules without governance
Rules hidden inside scripts are hard to maintain. They should be documented, versioned, and owned.
Ignoring root causes
Fixing data manually without addressing the source problem leads to repeated incidents.
Key Metrics for Data Quality Automation
Organizations should measure data quality like they measure system reliability. These metrics transform data quality from an abstract concern into a measurable management capability.
- Percentage of rules passing.
- Number of failed rules by severity.
- Number of affected records.
- Number of impacted dashboards.
- Average time to detect issues.
- Average time to resolve issues.
- Number of recurring issues.
- Freshness compliance rate.
- Duplicate rate.
- Completeness rate.
- Reconciliation difference.
- Rule coverage by data domain.
- Data quality score by owner or system.
Business value
The Business Value of Data Quality Automation
Automated quality controls create value by improving confidence, reducing risk, strengthening governance, and helping teams move faster with trusted data.
Faster decision-making
Teams spend less time debating numbers and more time acting on trusted information.
Reduced operational risk
Automated controls detect issues before they affect customers, finance, compliance, or operations.
Better governance
Rules, ownership, lineage, and issue management make governance measurable and operational.
Higher productivity
Data teams spend less time investigating recurring issues and more time building useful capabilities.
Improved reporting trust
Dashboards become more reliable because they are backed by automatic validation.
Better customer experience
Clean customer, product, and transaction data improves personalization, service, billing, and communication.
Stronger scalability
As the company grows, automated controls scale better than manual checks.
The Future of Data Quality Automation
The future of data quality automation will be more intelligent, more integrated, and more business-oriented. The direction is clear: data quality will become a continuous operational layer across the enterprise.
- More automated anomaly detection.
- Stronger integration with data catalogs.
- AI-assisted rule recommendation.
- Automated root cause analysis.
- Data contracts between producers and consumers.
- Real-time quality monitoring.
- Quality scores embedded in BI tools.
- Business-user workflows for validation and correction.
- Stronger connection between data quality and governance.
Conclusion
Trusted data is designed, automated, monitored, and governed.
Global data quality automation is essential for any organization that depends on data to operate, report, and make decisions. Manual checks are too slow, too fragile, and too difficult to scale.
The objective is not only to detect errors. It is to build trust. A strong strategy connects rules, metadata, ownership, monitoring, alerts, workflows, and business impact.
In a growing business, trusted data is not created by chance. Global data quality automation is the foundation that makes it possible.